
Field of View Diameter - what is the field of view in a microscope
×40 digital high-power field calculated (mm2) by multiplying the greatest X and Y dimensions for each monitor at various resolutions and slide viewers
Higher monitor resolutions were tested on the 27” Philips monitor as well as the 28” Microsoft Studio monitor. With default display resolution set at a 2560 × 1440 on the Philips monitor, the HPF areas calculated are shown in Table 1. Of note, these values were captured at the default (recommended) 200% scaling. Scaling is an operating system setting that adjusts the sizes of windows, images, icons, and text relative to the monitor resolution or pixel density. Scaling showed differences for desktop application and native text (only tested on the Microsoft Surface Studio). Scaling was modified at a 4500 × 3000 resolution to 100% and 200%. Scaling at 100% resulted in a larger area as the monitor scaled the applications and text halved their size. At 100% scaling, a digital × 40 HPF area was 3.30 mm2 (ImageScope), 0.802 mm2 (Philips IMS), 3.30 mm2 (CaseViewer), 0.705 mm2 (NDP.view), and 0.806 mm2 (MSK Slide Viewer).
Recent advances in care delivery methods have allowed pathologists to render pathologic diagnoses based on patient tissue samples such as biopsies and resections using a digital workflow.[23,24,25,26] Digital pathology using whole slide imaging to generate a digitized version of a glass slide with high resolution has been proven to be noninferior to its glass counterpart.[27,28,29,30] Digital pathology is a tremendous asset to the pathologist by providing novel tools for histopathology review, annotation and objective quantification for diagnostic evaluation, and computer-assisted image algorithms for analysis. However, from a regulatory perspective, vendor hardware and software thus far have been marketed to only use a specific display device (i.e., computer monitor) with accompanying vendor-specific WSI viewing software. Nonetheless, several pathology departments around the world have initiated primary diagnosis in pathology using digital means.[18,28,29] Therefore, a comparison of diagnostic tools that were formally performed using a traditional light microscope must now be re-evaluated in this emerging digital environment. One factor that warrants critical reappraisal is the HPF and its role in the histologic assessment of disease.
An additional variable inherent with higher resolution displays is scaling. Scaling is a variable dependent on the operating system and application utilized for image viewing. The purpose of scaling exists for ultra-high-resolution monitors, as text and icons can be very hard to read at the native high resolution, and they are also often displayed at a much smaller size (and less readable) than at a lower resolution. Therefore, certain elements are “scaled” up to be more user friendly and thereby improve the readable viewing experience. Hence, with higher resolution monitors, the pixel density can change the visualization of items presented on the screen. Scaling is dependent and inherent to the application development and may affect both desktop and web-based viewers. Of the desktop viewers tested on multiple monitors: ImageScope, CaseViewer, and NDP.view, scaling affected ImageScope and CaseViewer but not NDP.view. The Microsoft Surface Studio monitor used in this study showed a significant difference between 100% and 200% scaling at the same resolution and using the same image viewer software compared to other displays in all except NDP.view WSI viewer. The Microsoft Surface Studio with scaling at 100% showed 3.30 mm2, and at 200%, scaling showed 0.801 mm2 HPF areas using the ImageScope viewer but retained the same HPF area for both 100% and 200% scaling (e.g., 0.705 mm2) with the NDP.view software, meaning the NDP.view WSI viewer was not affected by scaling. Scaling also affected web-based viewers such as the Philips IMS and MSK Viewer, as the browser application interface changes. Similarly, web-based viewers have additional inherent web browser setting controls that may change HPF tissue images which are presented to the pathologist. Based on compatibility, some WSI viewers may not be programmed to open on other monitors other than those that were FDA-cleared for, such as the ImageScope DX viewer. In addition, proprietary file format compatibility with the WSI viewer may not allow for viewing of certain vendor WSI on other WSI viewers, such as Philips viewing of non-Philips WSI on the Philips IMS viewer. Of note, the MSK Slide Viewer was the only WSI viewer to have the functionality to view and navigate all WSIs from every vendor tested. This is critical for institutions with multiple vendor whole slide scanners to have a consistent user interface for the various WSI from each vendor.
For each combination of variables, the horizontal and vertical screen area for a digital × 40 field was measured using respective WSI software measurement tools. The “X” and “Y” axis measurements on the image viewer for the × 40 designated field were recorded and the total area calculated (Area digital HPF = Height × Width). Corresponding light microscope (Olympus BX43) ×40 HPFs were also measured, calculated (Area microscope HPF = π × radius2), and recorded. Further, comparisons were made between the × 40 digital HPF for each platform and WSI viewer with a × 10 ocular 20 mm and 22 mm diameter lens. Digital and microscopic HPF areas were then compared and quantified to calculate the equivalent number of digital versus microscope HPF.
High power microscope400x
This was extrapolated from values in Table 1 showing various 40×HPF areas for each monitor and combination of display resolution and image viewer. *At 200% scaling. HPF: High-power field
Secure .gov websites use HTTPS A lock ( Lock Locked padlock icon ) or https:// means you've safely connected to the .gov website. Share sensitive information only on official, secure websites.
Dimensions of ×40 digital high-power field for each monitor with various combinations of slide viewer and scanning platform
As the pathology community transitions into a fully digitized workflow for primary diagnosis, pathologists must be aware of technical differences between available diagnostic methodologies. While digital slides provide the pathologist with innovative diagnostic tools, pathologists should evaluate and assess the current standard of care with that of the digital era. This study showed that glass slide HPF at × 400 magnification on a light microscope was not equivalent to “×40” digital HPF areas. Tumor grading and other features requiring quantification dependent on HPFs may differ when using WSI. Digital HPF quantification may vary due to differences in the tissue area displayed by monitor sizes, display resolutions, and WSI viewers but not by scanner or scanning resolution. Furthermore, clinical validation of quantification of pathology parameters in HPF areas needs to be performed to ensure appropriate diagnostic standardization and reproducibility for diagnoses performed today.
Features include: • SS data transfer rates up to 5 Gbps (system dependent) • Compliance with the USB 3.0 interface standard • Nickel-plated plugs for enhanced signal transfer
USB Type A connectors have been the universal standard since USB 1.1, with connections built into wall sockets, computers, vehicles, televisions, interfaces, and audio technology of all kinds. USB 3.0 Type B can be found on larger devices such as printers and scanners. Some storage devices and drives use them, as well.
High power in microscopemeaning
The aim of this study was to pilot and evaluate variables by comparing conventional light microscope HPF (at × 400 magnification) to a digital HPF (at “×40” magnification). Potential variables evaluated included the whole slide scanner, scan resolution, image viewer, monitor size, aspect ratio, and display resolution.
Comparison of microscope high-power field to digital high-power field. Microscope high-power field using Olympus BX43 with × 10 ocular and 20 mm diameter and × 40 objective lens, 0.196 mm2 (red circle); “×40” high-power field magnification on NDP.view WSI viewer (green rectangle) using 27” Philips monitor at 1920 × 1200 display resolution
A significant variation of HPF area occurred between differing monitor size and display resolutions with minor differences between WSI viewers. No differences were identified by scanner or WSIs scanned at different resolutions (e.g., 0.5, 0.25, 0.24, and 0.12 μm/pixel).
To compare the digital HPF to standard × 40 objectives of most light microscopes, field areas for a × 40 digital HPF were compared to that of a × 40 field seen on a conventional bright-field microscope (e.g., Olympus BX43). These results are reported in Table 3. The difference in area ranged between -50% and 1586% comparing display resolution to a × 10 ocular lens with 20 mm and 22 mm diameter on a light microscope.
Nearly all modern electrical devices utilize a standard that is compatible with USB 3.0 cables. Some devices utilize USB 3.0 connectors Type B and Micro B, such as printers, scanners, storage drives, GPS units, and cell phones.
Currently, in the United States, there are only two FDA-cleared commercial platforms available for primary diagnosis by WSI.[16,17] These platforms are the Philips IntelliSite Pathology Solution and the Aperio AT2Dx system. This study compared the Philips system to other imaging platforms as well as a standard light microscope. Interestingly, without hiding the Windows taskbar (as most users have configured), the Philips 27” monitor with 2560 × 1440 display resolution when combined with Leica's Aperio ImageScope software created the most similar field area to that of a light microscope with 10.15 HPF required to equal 10 HPFs on a light microscope; using the FDA-cleared Philips IMS viewer with the same Philips 27” monitor 9.71 digital HPF was found to be equivalent to 10 HPFs of a light microscope (not shown in the table). In addition, the FDA-cleared Dell MR2416 monitor has the exact same specifications (i.e., monitor size, resolution, and aspect ratio) as the consumer-grade standard hospital configuration monitor tested (HP z24n G2) and similarly showed identical HPF tissue areas. Lower resolutions and smaller monitor sizes revealed smaller HPF areas compared to the FDA-cleared Philips system, while larger size monitors as well as higher resolutions revealed larger HPF areas. Therefore, the greatest variation in HPF was seen with changes in display resolution and to a lesser extent monitor size. There was minimal variation with the various image viewers and no observed difference due to WSI scanners and at varying scanning resolutions. To illustrate the variation and effect of monitor sizes and display resolution on HPF when using the same WSI scanned on a Philips UFS, the WSI viewed on a 24” HP monitor at 1920 × 1080 required 17.7 HPF to equal 10 light microscope HPFs while on a 28” Microsoft Studio monitor at 4500 × 3000 with 100% scaling required only 2.5 HPF fields. When comparing the same slide scanned on Philips UFS viewed on the 27” Philips monitor using different image viewer software, there was only a minimal difference ranging from 9.3 to 10.4 HPF required to equal 10 light microscope HPFs.
The SuperSpeed (SS) USB 3.0 Cable is designed to connect a device with a USB Type A interface to one with a USB 3.0 Type B interface. It is ideal for connecting an audio interface, external hard drive, or other computer peripherals to a PC via a SS USB Port.
Lowpoweronmicroscope
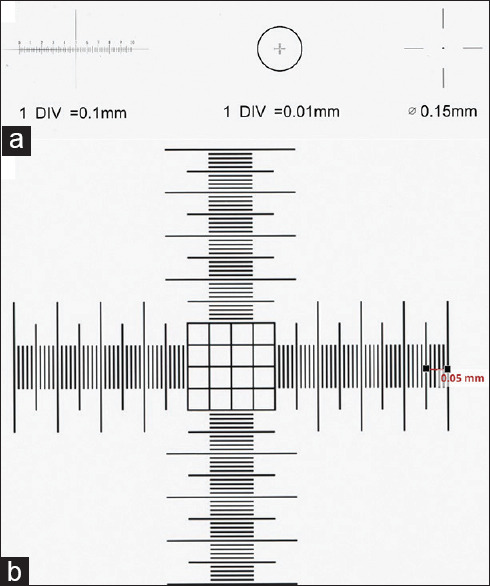
This study evaluated different variables deemed to play a critical role in a digital workflow when reporting patient pathology. These variables included the whole slide scanner device, scan resolution, software image viewer, monitor display resolution, monitor size, and aspect ratio. To evaluate these variables, a precision stage WSI slide calibrator with 0.005 mm and 0.01 mm markers [Figure 1] was scanned at × 40 equivalent resolution on the following commercially available whole slide scanners: (i) Aperio AT2DX (0.25 μm/pixel), Aperio AT2 (0.25 μm/pixel), Aperio ScanScope XT (0.25 μm/pixel), and Aperio AT2 GT450 (0.26 μm/pixel) scanners (Leica Biosystems, Buffalo Grove, IL), (ii) Hamamatsu Nanozoomer 2.0HT (0.23 μm/pixel) scanner (Hamamatsu City, Japan), (iii) P1000 (0.12 μm/pixel) scanner (3DHistech, Budapest, Hungary), and (iv) ultra-fast scanner (UFS) (0.25 μm/pixel) (Philips, Amsterdam, The Netherlands). In addition, this calibrator slide was scanned at a “×20” equivalent resolution (0.5 and 0.46 μm/pixel) on the Aperio AT2, Aperio AT2DX, Aperio ScanScope XT, and Hamamatsu Nanozoomer. The Aperio GT450 and Philips UFS can only scan at “×40” equivalent resolutions.
Counting HPFs using microscopy in pathology is essential in the evaluation of certain diseases (e.g., eosinophil and lymphocyte counts) and tumor type grading (e.g., mitotic figure counting). Specific histologic quantifications, such as counting of mitotic figures, are highly dependent on the precise area that is presented to the pathologist in a defined HPF.[14] Most conventional bright-field microscopes use a customary ocular lens (e.g., 20 mm or 22 mm) and magnification objectives that allow for a standardized and translatable definition for microscopic HPF. Using the tissue area viewed through a bright-field microscope, the mitotic count relies on the number of mitotic figures found based on a set number of HPFs. A mitotic count is quantified as the number of mitoses per the number of HPFs evaluated. Higher mitotic rates generally equate to a higher grade and more aggressive tumor biology.
Not all light microscopes have similar components to visualize the exact HPF area. This is due to differences in their ocular lenses and objectives. For this reason, for certain cancer checklist protocols (e.g., invasive breast carcinoma), the CAP offers a tabular guide for how mitotic counts vary using various microscope configurations.[31] As each light microscope may vary, the HPF evaluated that will, in turn, affect the mitotic count, and the CAP cancer protocols accordingly offer different mitotic cutoffs based on the light microscope field diameter and area. In addition, these CAP cancer protocols give guidance on how to determine the field diameter and area. Without such guidance in a digital workflow, diagnoses that rely on microscopic assessments using the HPF may result in wide variations as a result of differences with the hardware and software used. Lower resolution screens in this study had a smaller area compared to the microscope HPF with × 40 objective in both a 20 mm and 22 mm × 10 lens. In our study, as the display resolution increased, changes were observed up to 1586 % with the Microsoft Surface Studio monitor, compared to the HPF area of a microscope. A single HPF with the highest resolution monitor evaluated in this study was equivalent to a 16.9 HPF area of a conventional microscope (×10/20 mm ocular, ×40 objective).
High power microscopemagnification
The glass slides were successfully scanned on each whole slide scanner at scan resolutions of 0.5, 0.46, 0.26, 0.25, 0.23, and 0.12 μm/pixel. Each respective WSI, WSI viewer, whole slide scanner, monitor, and screen resolution were assessed with all available permutations permitted based on vendor interoperability. These digital HPF area combinations showed divergent results described below. A summary of the results for each variable is shown in Table 1.
The microscope high-power field (HPF) is the cornerstone for histopathology diagnostic evaluation such as the quantification of mitotic figures, lymphocytes, and tumor grading. With traditional light microscopy, HPFs are typically evaluated by quantifying histologic events in 10 fields of view at × 400 magnification. In the era of digital pathology, new variables are introduced that may affect HPF evaluation. The aim of this study was to determine the parameters that influence HPF in whole slide images (WSIs).
As the resolution and screen size increases so does the×40 digital HPF area. *One web-based viewer was not compatible with the high-resolution monitor at 200% scaling, shown in Figure 5. (HPF measurements differ, however, the represented tissue area is not reflected accurately). HPF: High-power field
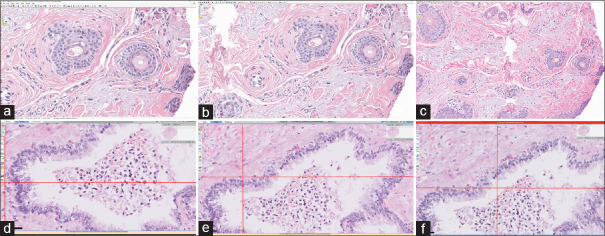
Digital high-power field area of the same focus shown on three different monitors and native resolutions. (a-c) Aperio ImageScope; d-f Philips IMS; (a and d) Hewlett Packard Z24n G2 (1920 × 1200); (b and e) Philips PS27QHDCR (2560 × 1440); (c and f) Microsoft Surface Studio (4500 × 3000). The same whole slide image viewer at a “×40” high-power field on different monitors and native display resolutions. Monitor resolution and size affected high-power field area the most. In addition, one web-based viewer was not compatible with the high-resolution monitor at 200% scaling (f)
Lowpowerobjectivemicroscopefunction
Glass slides scanned on various devices (Leica's Aperio GT450, AT2, and ScanScope XT; Philips UltraFast Scanner; Hamamatsu's Nanozoomer 2.0HT; and 3DHistech's P1000) were compared to acquired digital slides reviewed on each vendor's respective WSI viewer software (e.g., Aperio ImageScope, ImageScope DX, Philips IMS, 3DHistech CaseViewer, and Hamamatsu NDP.view) and an in-house developed vendor-agnostic viewer. WSIs were reviewed at “×40” equivalent HPF on different sized monitors with varying display resolutions (1900 × 1080–4500 × 3000) and aspect ratios (e.g., Food and Drug Administration [FDA]-cleared 27” Philips PS27QHDCR, FDA-cleared 24” Dell MR2416, 24” Hewlett Packard Z24n G2, and 28” Microsoft Surface Studio). Digital and microscopic HPF areas were calculated and compared.
For an FDA-cleared digital pathology system intended for primary diagnosis use, current approvals include a packaged end-to-end digital closed system that includes a whole slide scanner, specific monitor, and proprietary WSI viewer software. The data from this study suggest that as long as display resolution and monitor size remain equivalent when substituting components, little variation in HPF size is likely to be caused by different types of whole slide scanner or WSI viewer. Therefore, pathologists can be assured that the HPF area is relatively unchanged when a digital slide generated by the FDA-cleared Philips UFS is viewed on a non-FDA-cleared monitor of similar specifications to the Philips recommended monitor (27”, 2560 × 1400) or if examined with a non-Philips image viewer. These data thus suggest that current regulatory restrictions that prevent interchanging the components of a digital pathology system may not be warranted. As long as a digital pathology system is appropriately validated,[15,32] regardless of the type of slide scanner, monitor, or WSI viewer used, it is probable that a pathologist's ability to render an accurate diagnosis will not be hindered.
USB 3.0 cables utilize 9 connector wires, as opposed to 4 connector wires in USB 2.0. This allows for higher transfer speeds and more voltage. For charging devices, USB 2.0 is capable of up to 500 mA, whereas USB 3.0 is capable of up to 900 mA. The 5 additional wires also enable USB 3.0 cables to have two-way communication simultaneously. Unique connector types for USB 3.0, which are most often blue in color, are Type B and Micro B.
When controlling each of the four different monitors at the same screen resolution (e.g., 1920 × 1080 or 1920 × 1200), the visualized HPF area of the WSI on each respective WSI viewer at a digital × 40 magnification differed by a factor of up to 21%. A digital × 40 HPF using Leica's Aperio ImageScope and ImageScope DX, Philips IMS, 3DHistech's CaseViewer, Hamamatsu's NDP.view, and the MSK Slide Viewer was viewed on the 24” Dell monitor at a resolution of 1920 × 1080 resulting in areas of 0.117 mm2, 0.111 mm2, 0.113 mm2, 0.119 mm2, 0.107 mm2, and 0.110 mm2, respectively. Of note, the ImageScope DX viewer can only be used on the respective Dell monitor; when attempting to launch ImageScope DX on other monitors, an error message displays and does not launch the WSI. Table 1 shows the HPF area presented in each of the tested WSI viewers on each respective monitor at 1920 × 1080 and 1920 × 1200 pixel resolutions.
The various digital HPF areas at × 40 were compared to the area encompassed in 10 HPFs, the value typically required for many histopathologic quantifications (e.g., mitotic figure counts) using a light microscope within a 2 mm2 area. The number of equivalent HPFs for each respective monitor and display resolution is shown in Table 2. These represent the number of digital × 40 HPFs to equal 10 HPFs on a × 40 light microscope. An overlay of the area seen in one 27” Philips monitor at 1920 × 1200 display resolution HPF over a × 40 light microscope HPF using a × 10 ocular is shown in Figure 2. The largest monitor and highest resolution of monitors evaluated was the 28” Microsoft Surface Studio, and with 4500 × 3000 resolution at 100% scaling, the number of areas to achieve the same area as 10 HPFs on the light microscope was 0.6 (ImageScope), 2.5 (Philips IMS), 0.6 (CaseViewer), 2.8 (NDP.view), and 2.5 (MSK Slide Viewer) with each viewer. At 200% scaling for the Microsoft Studio monitor, the number of areas required was 2.5 (ImageScope), 10.4 (Philips IMS), 10.1 (CaseViewer), 2.8 (NDP.view), and 10.5 (MSK Slide Viewer).
USB (Universal Serial Bus) 3.0 was released in 2008 with approximately 10x the speed of USB 2.0 and was coined “SuperSpeed”. Because USB 3.0 utilized some of the same connector types as USB 2.0, along with a few new connectors, it was suggested that USB 3.0 cables be made blue to differentiate them. You can also see a compatibility chart of connector types here.
Maximum magnification of electronmicroscope
Whole slide image calibration slide. (a) The precision stage slide calibrator has 0.01 mm, 0.1 mm, and 0.15 mm markers and can be scanned for validation of measurement on whole slide image viewers; (b) The 0.01 marker section is magnified and shown with accurate measurement in the MSK slide viewer
Glass slide HPF at × 400 magnification with conventional light microscopy was not equivalent to “×40” digital HPF areas. Digital HPF quantification may vary due to differences in the tissue area displayed by monitor sizes, display resolutions, and WSI viewers but not by scanner or scanning resolution. These findings will need to be further clinically validated with potentially new digital metrics for evaluation.
All WSI file types were recursively analyzed using six different slide viewers (ImageScope v12.4 and ImageScope DX v1.0 from Leica, Philips IMS v3.2, CaseViewer v2.3 from 3DHistech, NDP.view v2.7 from Hamamatsu, and a homegrown MSK Slide Viewer v1.3). Four monitors were used for this study and consisted of an FDA-cleared 24” Dell monitor MR2416 (aspect ratio, 16:10; pixel pitch, 0.27 mm), consumer-grade 24” Hewlett Packard Z24n G2 monitor (aspect ratio, 16:10; pixel pitch, 0.27 mm), FDA-cleared 27” Philips monitor PS27QHDCR (aspect ratio, 16:9; pixel pitch, 0.2331 mm), and a 28” Microsoft Surface Studio monitor (aspect ratio, 3:2). Screen resolutions of 1920 × 1080 and 1920 × 1200 pixels were analyzed for all monitors and WSI viewers. Of note, the Microsoft Surface Studio's monitor is part of an all-in-one computer that is unique compared to the other monitors. Other monitors were reviewed on a 64-bit Hewlett Packard computer with an i5 3.2 GHz processor. For those monitors with high resolution (Philips monitor and Microsoft Surface Studio), additional higher resolutions were tested: 2560 × 1440 and 4500 × 3000 pixels, respectively. For the Microsoft Surface Studio monitor, application and text scaling were evaluated at 4500 × 3000 pixels native resolution, with the WSI viewer evaluated at both 100% and 200% (employing Windows 10 operating system). Display resolutions were modified using the Windows operating system Control Panel.
This is an open access journal, and articles are distributed under the terms of the Creative Commons Attribution-NonCommercial-ShareAlike 4.0 License, which allows others to remix, tweak, and build upon the work non-commercially, as long as appropriate credit is given and the new creations are licensed under the identical terms.
This study also identified minor differences in the HPF area as a result of image viewer software. This difference can be attributed to variations with each viewer application interface (e.g., toolbars and navigation panes). Further, each viewer has different elements presented on the screen that may obscure tissue being viewed [Figure 5]. With a conventional light microscope, there is no toolbar or overlay superimposed on the image field. For the purposes of this study, the user interface in each software viewer and operating system (e.g., Windows taskbar) were minimized as much as possible to maximally display the WSI viewport tissue area. Ideally, an image viewer could standardize a digital HPF by inserting bounding boxes of a fixed input size (i.e., 2 mm2) over an image. However, no such feature yet exists in any of the image viewers we tested. Fortunately, the different image viewers had a minor impact on HPF area in comparison to the differences seen with display resolution and monitor size.
High powerobjectivemicroscopefunction
Official websites use .gov A .gov website belongs to an official government organization in the United States.
The microscope high-power field (HPF) is routinely used as a tool in the reporting of certain pathology diagnoses. Pathologists using HPF for standardized quantification of mitosis for tumor grading are the current standard of care.[1] In addition, pathology evaluation using HPF counts aids in determining patient prognosis or management. For example, the number of mitotic figures in an HPF area is a standard reporting metric in patient pathology reports for many tumors. Criteria have been established and clinically validated, with specific quantification ranges, for a variety of tumors in which a mitotic count is essential for determination of tumor grade or for cellular quantification of eosinophils, lymphocytes, and other histopathologic features. Most tumors that require a mitotic count have a three-tiered grading system based on a defined HPF area. For instance, gastrointestinal stromal tumors necessitate counting of 50 HPF overall comprising a 5 mm2 area for evaluation of risk stratification.[2] In comparison, gastrointestinal neuroendocrine tumors, carcinoid tumors of the lung, and invasive ductal carcinoma of the breast require 10 HPFs consisting of a 2.0 mm2 area.[3,4] These metrics are largely based on predigital era publications reporting outcome differences based on histopathology events in selected HPF areas.[5,6,7,8,9,10,11,12,13] In current practice, variables affecting the microscope HPF include objective and ocular magnification differences. While such variables are few, these differences would alter the HPF area presented to the pathologist when performing such tasks.[14]
Recent advances in pathology have established a new standard of care using digital pathology systems. In 2013, the College of American Pathologists (CAP) acknowledged that the usage of digital slides for primary diagnosis was emerging and recommended guidelines for validating a digital pathology system that generated whole slide images (WSIs).[15] In addition, the Food and Drug Administration (FDA) has cleared two WSI platforms (Aperio AT2DX and Philips IntelliSite Pathology Solution) for primary diagnostic purposes.[16,17] Both systems have been extensively validated for a digital primary pathologic evaluation and diagnosis.[18,19,20] However, there is a paucity of literature providing insight into how novel digital workflows affect standardized pathology reporting, specifically related to reporting elements based on the HPF. With a digital workflow, there are differences between glass slide visualization on a traditional light microscope versus a digital representation of the WSI. In a digital pathology system comprising both hardware (e.g., WSI scanner) and software (e.g., image viewer and computer monitor) components, there are several parameters (e.g., scanner optics, camera sensors, and digital resolution) that can contribute to variations affecting representation of the HPF area.[21,22] These parameters can, in turn, affect the evaluation of histopathologic tissue, specifically the area that is represented in a digital HPF compared to an HPF on a bright-field microscope.
The same WSI viewer with differences in user interface adjustments. Aperio ImageScope DX WSI viewer with: A, slide tray closed (264.1 mm × 473.1 mm); and B, slide tray open (264.1 mm × 363.9 mm). On the 24” Dell monitor at 1920 × 1200 resolution, the high-power field area difference was 30%
In summary, as digital pathology becomes increasingly adopted and pathologists turn to primary diagnosis using a digital workflow, ensuring clinical reproducibility in regard to HPF area measurements is necessary. This study demonstrates critical components of the digital workflow and respective effects of each component on HPF area representation for clinical reporting of patient pathology. The future role of digital and computational pathology in areas such as HPF assessment of pathology parameters needs to be considered, analyzed, and standardized.[33,34] It is plausible the ground truth and outcomes used today may no longer be applicable in a digital workflow where novel metrics using artificial intelligent tools could be instituted (i.e., automated mitotic figure quantification and ratio of mitoses per tissue area or per number of tumor cells).[35] Notably, this gives an opportunity to validate these tools against prospective clinical cohorts and comparatively evaluate the data to current pathology grading systems and outcomes.[36]
High power Microscope40X
Address for correspondence: Dr. Matthew G. Hanna, Department of Pathology, Memorial Sloan Kettering Cancer Center, New York, NY, USA. E-mail: hannam@mskcc.org
The different whole slide scanners tested had varying scanning resolutions. The scanning resolutions for each scanner are 0.25 and 0.5 μm/pixel at “×20” and “×40” scan resolution for the Aperio ScanScope XT, Aperio AT2, and for the Aperio AT2DX; 0.26 μm/pixel at “×40” scan resolution for the Aperio GT450; 0.23 and 0.46 μm/pixel at “×20” and “×40” scan resolution for the Hamamatsu Nanozoomer 2.0HT; 0.12 μm/pixel at “×40” scan resolution for the 3DHistech P1000; and 0.25 μm/pixel at “×40” scan resolution for the Philips UFS. It is worth mentioning that the reported scanning resolution of each platform is rounded, and small differences may not be accounted for as such. Each respective WSI was evaluated at a × 40 digital HPF on all monitors and using all WSI viewer software. There was no change in the presented HPF area for WSIs scanned at the different μm/pixel resolutions. Controlling for WSI scan resolution, a single WSI was viewed on each monitor, respectively. The presented HPF area was the same on each respective monitor when the other variables remained constant (e.g., screen size, aspect ratio, and display resolution), regardless of the scanning μm/pixel resolution. Of note, ImageScope and ImageScope DX did not have the ability to display a × 40 magnification in the viewport when the WSI was scanned at a “×20” equivalent resolution (i.e., digital zoom).
The same high-power field tissue area shown on four WSI viewer software displayed on the same monitor size and resolution. (a) Philips IMS; (b) MSK Viewer; (c) Aperio ImageScope; (d) 3DHistech CaseViewer. The same high-power field area of tissue seen on four different whole slide image viewer software viewed on the same monitor size and resolution (Philips PS27QHDCR). There are very minor differences in the tissue size area represented as a result of user interface variations (e.g., toolbars)
In addition, to the monitors described previously, the workstation included a standard keyboard and mouse to interact with the slides. The monitors were connected to a Hewlett Packard EliteDesk 800 with an Intel core i5, 3.2 GHz processor, and 8 GB random access memory.
SS USB cables transfer data at a max rate of 5 Gbps (5,120 Mbps), though 3,200 Mbps is a more realistic and common rate for average use. Conversely, USB 2.0 transfers at 480 Mbps, and USB 1.1 has a maximum transfer of 12 Mbps.
Our study sought to investigate if any differences between conventional light microscope and digital modalities exist, to provide guidance in reporting of pathology parameters using the HPF. The differences we uncovered suggest a need for either additional software development to ensure comparable tissue presentation of a single HPF to a pathologist using WSI or that formal pathologic criteria/scoring systems be re-evaluated to accommodate digital pathology. Pathologists may reference the results in the tables published in this study for identification of HPF area, especially for comparison between varied workstation settings between pathology departments. Investigating possible permutations of potential variables that may impact the HPF, we first identified the different components of a digital pathology system that could affect the area viewed in a × 400 microscopic field (×40 objective). Using digital pathology, the ocular and objective lenses of a light microscope are substituted by different digital components, such as the whole slide scanner, digital camera used to acquire an image (e.g., sensor resolution), image scanning resolution (pixels/micron), digital image file (e.g., image compression and file type), WSI viewing software, and display monitor (i.e., differing display resolutions, monitor size, and aspect ratio). The aim of this study was to evaluate how these differences may affect the pathologic evaluation of tissue features reliant on HPFs. The results overall showed that there is wide variability in the HPF area using different hardware and software and that such differences in tissue area presented to a pathologist are divergent from those seen using a light microscope [Figure 3]. Using standard monitor configurations commonly used in clinical settings, the screen resolutions studied were between 1920 × 1080 and 4500 × 3000. The lowest display resolution (e.g., 1920 × 1080) resulted in a digital HPF that was nearly 50% smaller than that seen with a light microscope HPF. This would hypothetically require almost twice the amount of HPF tissue to be microscopically evaluated to be comparable to an equivalent evaluation on a light microscope. For example, if 10 HPFs are required to adequately evaluate a mitotic count on a light microscope, a 1920 × 1080 resolution display would require around 20 HPF to be assessed. In contrast, the highest display resolution (e.g., Microsoft Surface Studio; 4500 × 3000 at 100% scaling) evaluated could require less than a single HPF (e.g., 0.6 HPF) to display all of the pixels necessary for evaluating an area comprising 10 conventional light microscopic HPFs. Trying to maximize the tissue area shown across each WSI viewer, this study reports small differences identified between the various software viewers due to user interface variances (e.g., toolbar placements and design layout). However, in a given WSI viewer, there may be significant differences in tissue area in the viewport based on the user interface [Figure 4]. Therefore, depending on the display resolution, monitor size, and image viewer that a pathologist uses when viewing a WSI, there may be differences in the size of the tissue area a pathologist evaluates when engaged in a digital workflow. Understanding these differences and validating these alterations are necessary to ensure that the tasks pathologists are required to perform (e.g., tumor grading) are appropriate and accurate. Pathologists who are unaware of the impact different variables may have on the HPF can lead to an over- or underestimation of mitotic counts, eosinophil quantification, lymphocyte quantitation, and so on when rendering pathology reports.
This dimension was then compared to the diameter of a 10×/20 mm and 10×/22 mm, 40×objective by calculating the delta as a percentage change. HPF: High-power field


 Ms.Cici
 8618319014500