
How to evaluate the quality of optical industrial lenses?
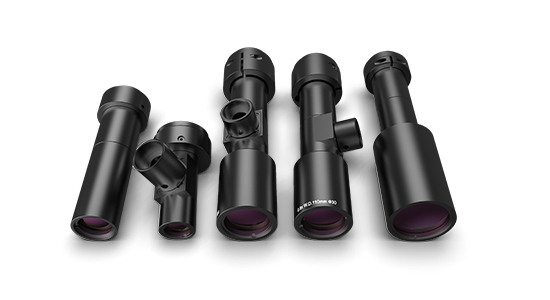
Optical industrial lenses, as the "eyes" of optical imaging systems, have imaging quality that directly determines the clarity, color reproduction, and detail of images or videos. When evaluating or calibrating the performance or image quality of an imaging system, an objective evaluation index is very important. Image quality can be defined by different indicators, especially resolution, modulation transfer function, distortion, chromatic aberration, etc. To use these indicators, you must first know what each of them represents and how it affects the performance of the lens.
1. Resolution
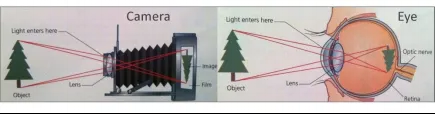
Resolution is a measure of the lens' ability to distinguish details of an object and is the primary indicator of lens imaging quality. Resolution represents the smallest size that an optical system can distinguish in a certain dimension. Take the human eye as an example (the human eye can be considered as a camera plus a zoom lens). The eye resolution of a healthy person without environmental influences is about 1 arc minute (1/60 degree), which means that the black and white spacing that can be distinguished at a distance of one meter is about 0.29mm. So we can say that 0.29mm is the resolution of the eye at this time. The commonly used unit of resolution is line pair number (lp/mm). 0.29mm is: 1/(0.29*2)=1.7lp/mm
Line pairs are usually described by their frequency: the number of lines that fit into a given unit length. Therefore, the frequency is usually expressed as "lp/mm" (the number of black and white pairs that can be distinguished in one millimeter).
2. Modulation Transfer Function (MTF)
MTF is one of the most important parameters for measuring image quality. MTF is a quantitative description of the clarity of lens imaging (including two factors: resolution and sharpness), and comprehensively reflects the imaging capability of the lens.
The detector size of high-definition surveillance cameras is usually 1/2”-2/3”, the pixel size is 4.5~5.5μm, and the corresponding spatial frequency is 110lp/mm~90lp/mm. As shown in the figure below, it is the MTF curve of the central field of view of a lens.
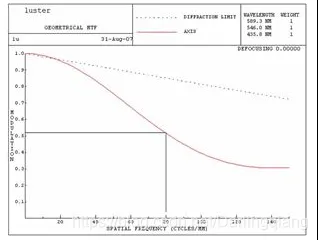
In the figure, the horizontal axis is the spatial frequency, and the vertical axis is the MTF value. Since there are always aberrations in actual imaging, the contrast of the image always decreases, and the MTF, which is the contrast attenuation factor, is always less than 1. The MTF value at any position on the image plane is a function of the spatial frequency. Generally speaking, the higher the spatial frequency, the lower the MTF value, which means that the contrast of high-frequency information decays faster. For example, the MTF corresponding to the spatial frequency of 80 lp/mm in the figure is 0.52, which means that for the central field of view, the imaging contrast of the signal with a spatial frequency of 80 lp/mm will drop by about half (relative to the actual target).
Monitoring applications are mainly for human observation. The system's MTF>0.22 can meet the requirements of human observation. Therefore, for the lens, MTF>0.3 can meet the requirements.
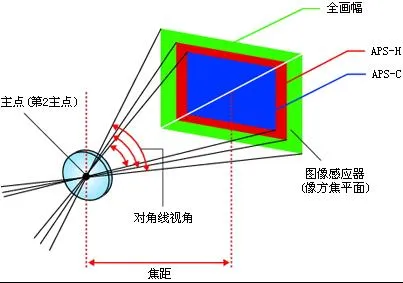
3. Focal length
Focal length refers to the distance from the main point of the lens to the focal point, which is an important performance indicator of the lens. The length of the lens focal length determines the size of the image, the field of view, the depth of field, and the perspective of the picture.
4. Distortion
The geometric deformation that may occur when the lens forms an image can be regarded as the result of different magnifications of different parts of the image plane, which is a kind of magnification aberration. It includes barrel distortion (negative distortion) and pincushion distortion (positive distortion). Distortion detection helps evaluate the fidelity of the lens to the image shape.
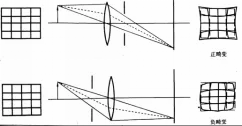
In ideal imaging, the object and the image should be completely similar, that is, the imaging does not cause local deformation, but in actual imaging, there is often some deformation. The distortion is caused by the optical structure of the lens and the imaging characteristics.
Generally speaking, monitoring applications do not undertake high-precision measurement tasks, so they have a higher tolerance for distortion. However, excessive distortion will affect the observation effect, so controlling the distortion rate within 5%~10% can usually meet most monitoring needs.
5. Chromatic aberration
Because the lens refracts light of different wavelengths to different degrees, chromatic aberration occurs during imaging. Chromatic aberration detection is the key to evaluating the accuracy of lens color reproduction.
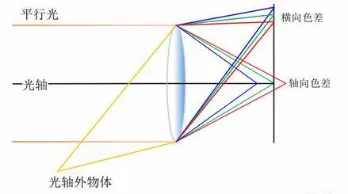
Theoretically, chromatic aberration can occur in the center and at the edges of an image, but it is more obvious at the edges because the light path is longer. Purple is also particularly sensitive to chromatic aberration because short wavelengths have a higher refractive index.
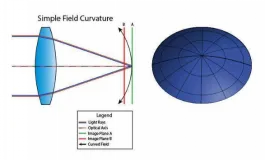
6. Field curvature
On a flat image plane, the clarity of the image changes from the center to the outside, and the focus forms an arc, which is called field curvature. Field curvature causes the clarity of the edge of the field of view to decrease relative to the center, that is, the MTF decreases.
The most intuitive manifestation of field curvature is that the center of the image may be clear, while the edge becomes blurred. When adjusting the focus, it is difficult to find a position that makes the entire picture in the best clarity.
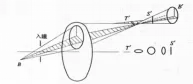
7. Astigmatism
Astigmatism causes the image of an off-axis object point to become two short focal lines that are perpendicular to each other and a certain distance apart in space, while forming elliptical or circular diffuse spots on other cross sections.
The most direct impact of astigmatism is that it reduces the clarity of the entire image or a part of it. In addition to affecting the clarity, it may also cause changes in the image such as stretching or compression.

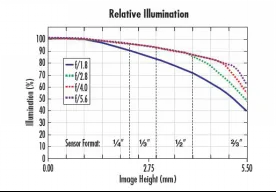
8. Relative illumination
The ratio of the illumination at the center of the field of view angle to the full field of view angle on the imaging plane. By comparing the relative illumination values at different positions, we can understand the uniformity of light distribution in the entire field of view of the optical lens. This is very important to ensure the consistency of image quality.
If the relative illumination of a certain area is significantly lower than that of other areas, it may mean that there are design or manufacturing problems, such as lens contamination, uneven coating, etc., which will affect the final imaging effect.
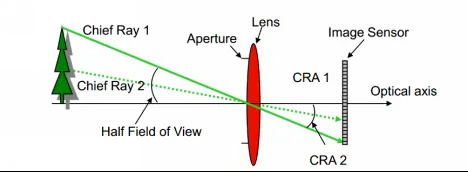
9. Chief ray angle
The chief ray is defined in optics as an off-axis ray passing through the center of the entrance pupil, and the angle between the chief ray and the detector normal is the chief ray angle of the lens.
CRA is a very important parameter in lens design and performance evaluation, and is crucial to understanding aspects such as image quality, color reproduction, and how the different components best match each other.


 Ms.Cici
 8618319014500